


Most people don't have a habit problem. They have a measurement problem. They log a streak, feel good, feel bad, quit, restart, and never actually know whether the thing they're doing is working. The data is there. What's missing is a set of rules for reading it.
The uncomfortable truth about tracking anything long-term: the longer your timeline, the more noise piles up. Sleep swings with seasons. Motivation tanks in February. You get sick, travel, work explodes for three weeks. Try to draw a conclusion from any single week and you're basically reading tea leaves. And yet that's exactly what most tracking apps encourage — daily numbers, daily dopamine, daily overreaction.
Applying a bit of measurement discipline for personal growth doesn't mean turning yourself into a research lab. It means borrowing a few cheap ideas — sampling cadence, minimal detectable change, baseline stability — and using them to separate a real trend from random wiggle. That's the whole game over months-to-years timelines. Signal versus noise.
The pieces connect, and skipping one usually breaks the others.
The core problem: you're sampling too often and interpreting too fast
The most common mistake in personal tracking is treating high-frequency data as high-quality data. People assume measuring every day gives them more truth. It gives them more points, not more truth.
Think about what a daily mood score actually contains. Maybe 30% is your underlying trend — the thing you care about. The rest is noise: how you slept, whether you ate lunch, a random text that annoyed you. When you eyeball a daily chart, your brain latches onto the noise because noise moves the most. Trends are quiet. Noise is loud.
The fix isn't necessarily measuring less often (though sometimes it is). It's to interpret at a slower cadence than you collect. Log daily, but only draw conclusions monthly or quarterly. That single separation — collection cadence vs. interpretation cadence — solves half the problems people have with long-term tracking.
Match your sampling cadence to how fast the thing actually changes
Different habits move at different speeds, and your sampling cadence should match the speed of the underlying change, not your enthusiasm.
Achieve more by focusing on what matters.
Growyly helps you build lasting habits and track your personal growth effortlessly.
- Goal setting with progress tracking
- Daily habit reminders
- Motivational insights and analytics
No credit card required
| What you're tracking | How fast it really changes | Sensible logging cadence | When to interpret |
|---|---|---|---|
| Mood, energy, focus | Hourly to daily swings, slow trend | Daily (quick rating) | Monthly rolling average |
| Strength / reps / pace | Weekly-ish adaptation | Per session | Every 4–6 weeks |
| Body weight | Daily noise, slow real change | Daily or 3x/week | Monthly average |
| Reading / writing output | Weekly rhythm | Per session or weekly total | Quarterly |
| Sleep consistency | Weekly patterns | Nightly | Every 3–4 weeks |
| Skill competence | Months | Weekly artifact/check | Quarterly |
The pattern: fast-changing signals need frequent sampling but aggregated interpretation. Slow-changing signals — skill, body composition — can be sampled less often, but you have to be patient reading them.
One mistake people make constantly is sampling a slow variable at a fast cadence and panicking. Weighing yourself daily and reacting to a two-pound jump is the classic example. That two pounds is water, salt, and timing. The real signal only shows up in a 30-day average. If your interpretation cadence matched the biology, the panic never happens.
Establish a baseline before you touch anything
You cannot detect change without a stable starting point, and "stable" is a specific thing, not a vibe.
Before starting a new habit or intervention, collect baseline data long enough to see your normal range of noise. For a daily-swinging metric, that's usually 2–4 weeks. For a weekly one, more like 6–8 weeks. The point isn't to get a single number — it's to learn how much your metric bounces around when nothing is deliberately changing.
-
Collect at least 14–20 baseline data points at your normal cadence.
-
Calculate the average.
-
Calculate the spread — simplest version
what's the typical distance between your high days and low days?
-
Split your baseline in half (first week vs. second week). If the two halves have wildly different averages, your baseline isn't stable yet. Keep collecting.
That last step catches the most common trap. People start "measuring" during a chaotic period — new job, holidays, a breakup — and treat that stretch as baseline. Then any later improvement looks massive, when really they just compared against a rough patch. A stable baseline means the first half and second half roughly agree.
If your baseline won't stabilize no matter how long you wait, that itself is a finding: your life or your metric is too volatile right now to detect small changes. Either pick a coarser metric or wait for a calmer window.
Minimal detectable change: the number that saves you from lying to yourself
This is the concept most people have never heard of and the one that changes everything. Minimal detectable change (MDC) is the smallest shift that's actually bigger than your own noise. Anything smaller than your MDC is meaningless, no matter how good the story you tell around it.
You don't need real statistics for a personal version. A pragmatic shortcut:
-
Take your baseline spread (the typical bounce between your normal high and low days).
-
Your rough minimal detectable change is about that spread, sometimes a bit more.
So if your daily focus rating normally bounces between 5 and 8 during a stable baseline, your noise band is roughly 3 points. A new intervention that "raises focus by 1 point" is inside the noise. You cannot claim it worked. You'd need to see the monthly average move by something on the order of your noise band before you take it seriously.
A worked example. Say you're tracking weekly writing output:
-
Baseline (8 weeks)
averages around 1,900 words/week, bouncing between roughly 1,200 and 2,700.
-
Noise band
about 1,500 words wide. That's big.
-
You start a new morning writing block.
-
After 6 weeks, new average is around 2,400 words/week.
Is that real? The improvement (500 words) is smaller than your noise band (1,500). On its own, not convincing. But — and this matters — if the new weeks are consistently landing at the top of your old range and rarely dipping to the old lows, that's a different kind of evidence. The floor moved. Watching your low points rise is often a cleaner signal than watching the average, because a rising floor is harder to fake with a couple of good days.
This is exactly the kind of thinking behind picking the smallest signals that actually predict change — small doesn't mean sensitive to noise; it means chosen carefully enough to move above it.
A validation checklist before you trust any conclusion
Before you declare "this habit is working" or "this experiment failed," run it through a short validation pass:
-
Do I have a stable baseline (first half ≈ second half)?
-
Is my observed change bigger than my noise band (minimal detectable change)?
-
Did I interpret at the right cadence (monthly/quarterly, not daily)?
-
Did the floor move, not just a few peak days?
-
Can I rule out an obvious confound (season, new job, illness, a big life event)?
-
Did I change only one meaningful thing, or five things at once?
-
Has the change held for at least two interpretation windows, not just one?
That last box is the one people skip most. A change that shows up in one month and vanishes the next wasn't a change — it was a fluctuation. Real habit effects tend to persist across at least two windows. If it can't survive a second look, don't build on it.
The "one thing at a time" box is brutal in practice. People overhaul their whole routine and then can't tell what did the work. If you want to attribute cause, isolate changes — which is the whole logic behind running fast, low-risk two-week experiments before committing to something for a year.
Build a sampling calendar so you're not deciding on the fly
Most people interpret too fast because they never scheduled when to interpret. So they check constantly. Fix it by writing a sampling calendar up front — a boring document that tells future-you when to look and when to leave it alone.
A workable annual structure follows a consistent rhythm across four different timeframes.
Daily/weekly: Log only. No conclusions allowed. You're just feeding the dataset.
End of each month: Compute the rolling average for each metric. Compare to last month. Write one sentence per habit. Don't make changes yet unless something clearly crossed your MDC.
End of each quarter: This is your real decision point. Look at the three monthly averages together. Is there a trend? Did the floor rise? Run the validation checklist. This is when you decide to keep, adjust, or retire a habit.
Twice a year: Re-baseline. Life changes, seasons change, and your old noise band may no longer apply. A summer baseline and a winter baseline can look genuinely different for energy and sleep.
Here's a simple visual of that calendar workflow.
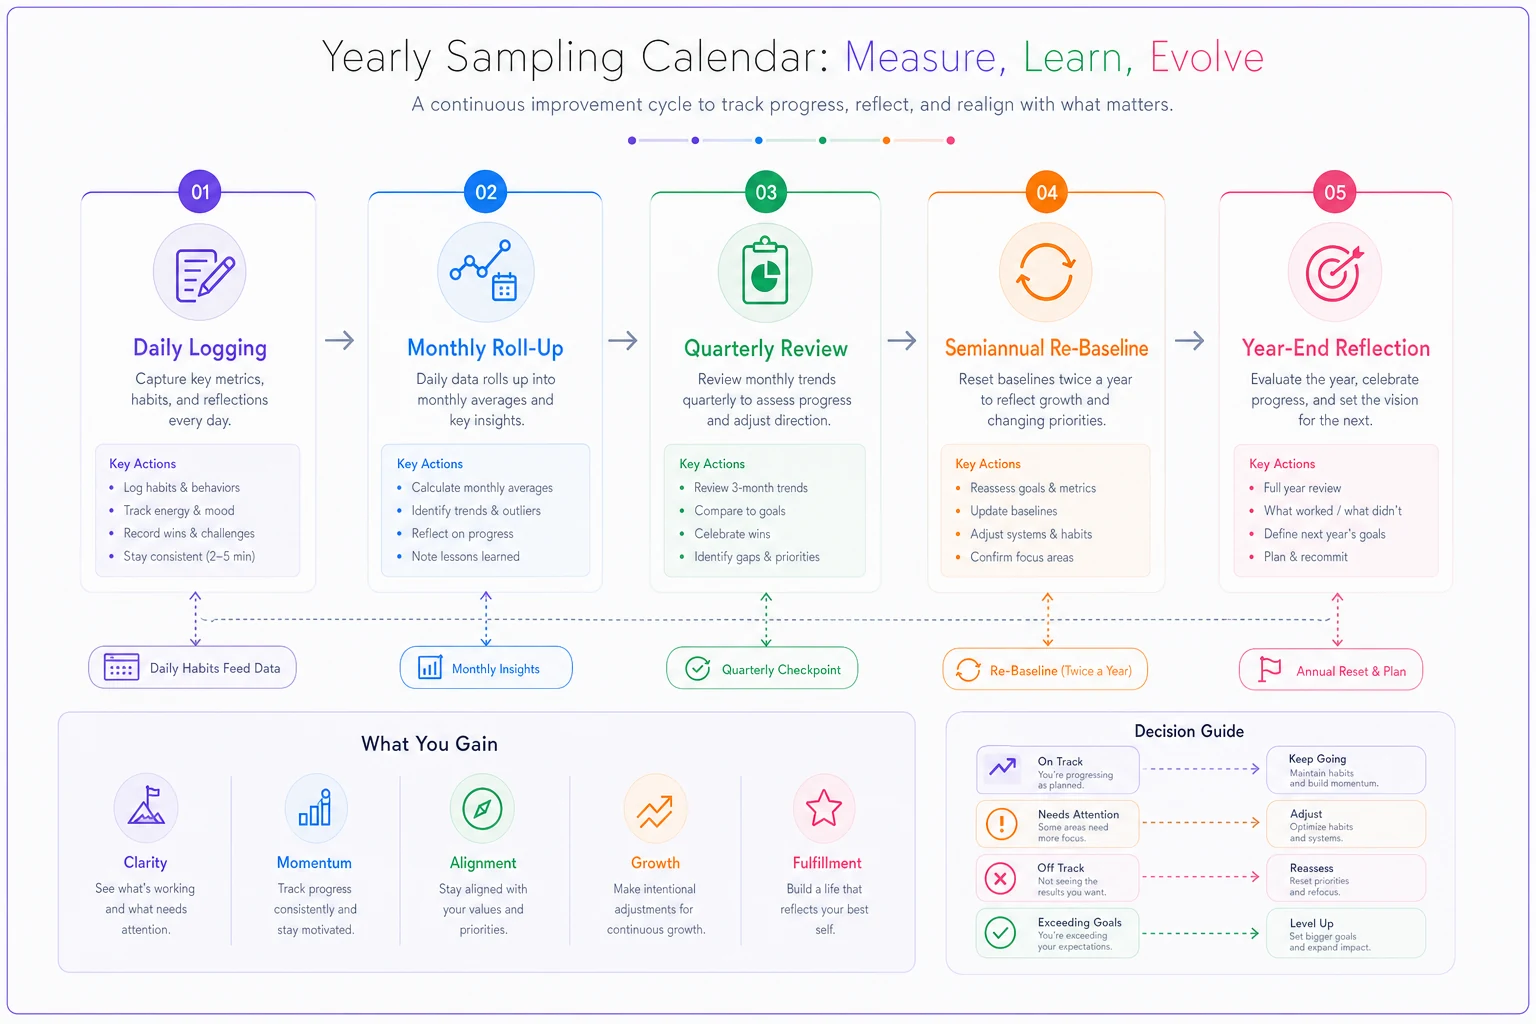
The calendar removes emotion from the timing. You're not checking your data because you feel anxious or triumphant — you're checking because it's the third of the month. That discipline alone kills most of the overreaction problem.
When this level of rigor makes sense — and when it doesn't
Not every habit deserves this treatment.
-
You're working toward long-horizon goals (fitness, skill-building, sleep, mood) where you'll invest months or years.
-
You're spending real money or time on interventions and want to know if they pay off.
-
You've restarted something several times and keep feeling unsure about whether it's actually working.
Probably overkill when:
-
The habit is brand new — in the first few weeks, just do it. Consistency matters more than measurement early on.
-
It's a simple binary habit (flossed / didn't) where a rough streak is fine.
-
You're doing something purely because you enjoy it. Measuring joy tends to kill it.
If tracking makes you anxious or obsessive, heavy measurement is the wrong tool. A rough monthly gut-check beats a spreadsheet that spikes your stress. The point of measurement is better decisions, not more numbers.
A real scenario: reading two years of running data
A recreational runner in their late 30s, tracking pace and weekly mileage for about two years. Their frustration: "I feel like I'm not getting faster."
Looking at the raw data, they were right to feel confused. Week to week, average pace bounced around by 20–40 seconds per mile. Hot days, tired legs, hilly routes — the noise was enormous. On any given week you could tell a story of progress or decline.
Ignoring weeks entirely and looking at quarterly averages on flat, moderate-temperature runs only (controlling one obvious confound), the picture changed. Over eight quarters, pace on comparable runs improved from roughly 9:40/mile to about 8:55/mile. Not dramatic quarter-to-quarter — maybe 8–12 seconds each — but a clear, persistent floor lifting across multiple windows.
The improvement had always been there. It was just smaller than the weekly noise, so constant checking had buried it completely. Once the interpretation cadence matched the pace of real adaptation, the "I'm not improving" feeling evaporated. Nothing about their training changed. Only the reading did.
Where software helps — and where it quietly makes things worse
Most habit apps are optimized for the exact behavior you're trying to avoid: daily engagement, daily numbers, daily reactions. They want you opening the app constantly, which is the opposite of interpreting at the right cadence.
What actually helps is tooling that does the boring aggregation for you — rolling averages, baseline comparisons, quarter-over-quarter views — and stays quiet the rest of the time. This is one place where AI-assisted tracking can genuinely earn its keep: automatically flagging when a change has cleared your personal noise band, spotting an obvious confound like a travel week or a sick stretch and excluding it, or nudging you at your scheduled interpretation date instead of every morning. Used that way, automation reduces both the manual math and the emotional over-checking.
The trap is letting an app interpret for you with cheerful streak celebrations and vanity metrics. Automation should surface the signal and get out of the way — not manufacture excitement out of noise. If your tools are making you feel something every day, they're probably working against your measurement.
The whole system, in one breath
These rules aren't separate tips — they're one connected system. Your baseline tells you your noise. Your noise tells you your minimal detectable change. Your MDC tells you what counts as real. Your sampling cadence feeds the data, and your interpretation cadence — enforced by a calendar — keeps you from reacting to noise. The validation checklist is the final gate before you act. Break one link and the others start lying to you.
Long-term tracking fails not because people lack discipline, but because they read their data at the wrong speed with no sense of their own noise. Slow down the interpreting, learn your noise band, and require any change to prove itself across two windows before you believe it. Do that, and months-to-years tracking stops being a source of anxiety and starts being what it should be: a quiet, honest mirror of whether you're actually moving.
Ready to unlock your full potential?
Join thousands of users transforming their lives using Growyly to stay motivated, organized, and growth-focused every day.